
Reports the AI builds with you, from a conversation
For years we've built custom Fishbowl reports by hand. Now the AI drafts them with you — CloudPages, Jasper reports, BI dashboards and Data Module queries — and the same rule applies to every one: it shows you the report, and installs nothing until you've seen it work.
Pick a format to watch
One conversation, whichever report you need. Choose a format and watch that session — one at a time.
A shareable page, live from your data
Someone asks for a CloudPage showing what inventory is worth at each location — and to see it first. The AI drafts it, builds each section, renders a live preview, and installs it only after you've looked.
The draft is ready to look at — nothing is installed yet.
Preview (live data, read-only): https://your-fishbowl.cloudpages.app/preview/inventory-value-by-location
What it shows
- One row per location, with its type, number of distinct parts, quantity on hand and value.
- Rows are grouped by location group (LA, Main, MI, SLC), with qty and value subtotals for each group.
- An optional location group filter, and CSV/XLSX export.
- It loads as soon as it opens.
What your data shows right now (I checked this with the same query)
| Group | Value |
|---|---|
| LA | $44,870 |
| MI | $32,803 |
| Main | $19,117 |
| SLC | $4,002 |
| Total | ≈ $100,792 |
Things to check while you look
- Value is on-hand qty × Fishbowl's current average cost per part. I couldn't read your costing-method setting, because that table is blocked. If you're on FIFO or Standard cost, these numbers won't exactly match your GL. I can switch the page to cost layers or standard cost instead.
- Receiving, Shipping and Manufacturing locations are included. For example, Main/Receiving holds about $5.8k. Tell me if you want stock-type locations only.
- LA has a location called "ZZTESTLOC" with $19.60 in it. You may want to clean that up, or I can exclude it.
- There's no grand-total row on the page. CloudPages supports only one subtotal level, so I chose per-group subtotals. The overall total is one XLSX export away.
Once you've looked at the preview, tell me any changes, or just say "install". After it's installed, an admin will need to grant access to the page in Fishbowl.
The Inventory Value by Location page is now installed in Fishbowl as version 1, with the page ID inventory-value-by-location.
To start using it:
- Open the page: reopen the CloudPages module to see it now. Otherwise it appears within about 10 minutes.
- Grant access: no one can open the page until an admin gives a group access to its entry in Fishbowl. Make sure your own group is included.
The preview reported no errors.
If you want to switch to FIFO or standard cost later, I can update this page in place, and the access grants will still apply. Each install is kept as a version, so you can roll back if needed.
The page the AI rendered for review — nothing was installed until it was approved.
A printable report, rebuilt from a picture
A buyer hands over a picture of the 4×6 shipping label they want. The AI reads the image, confirms a few design choices with you, rebuilds it as a real Jasper report, and installs it. Jasper has no live preview, so it shows you the design and the field mapping instead.
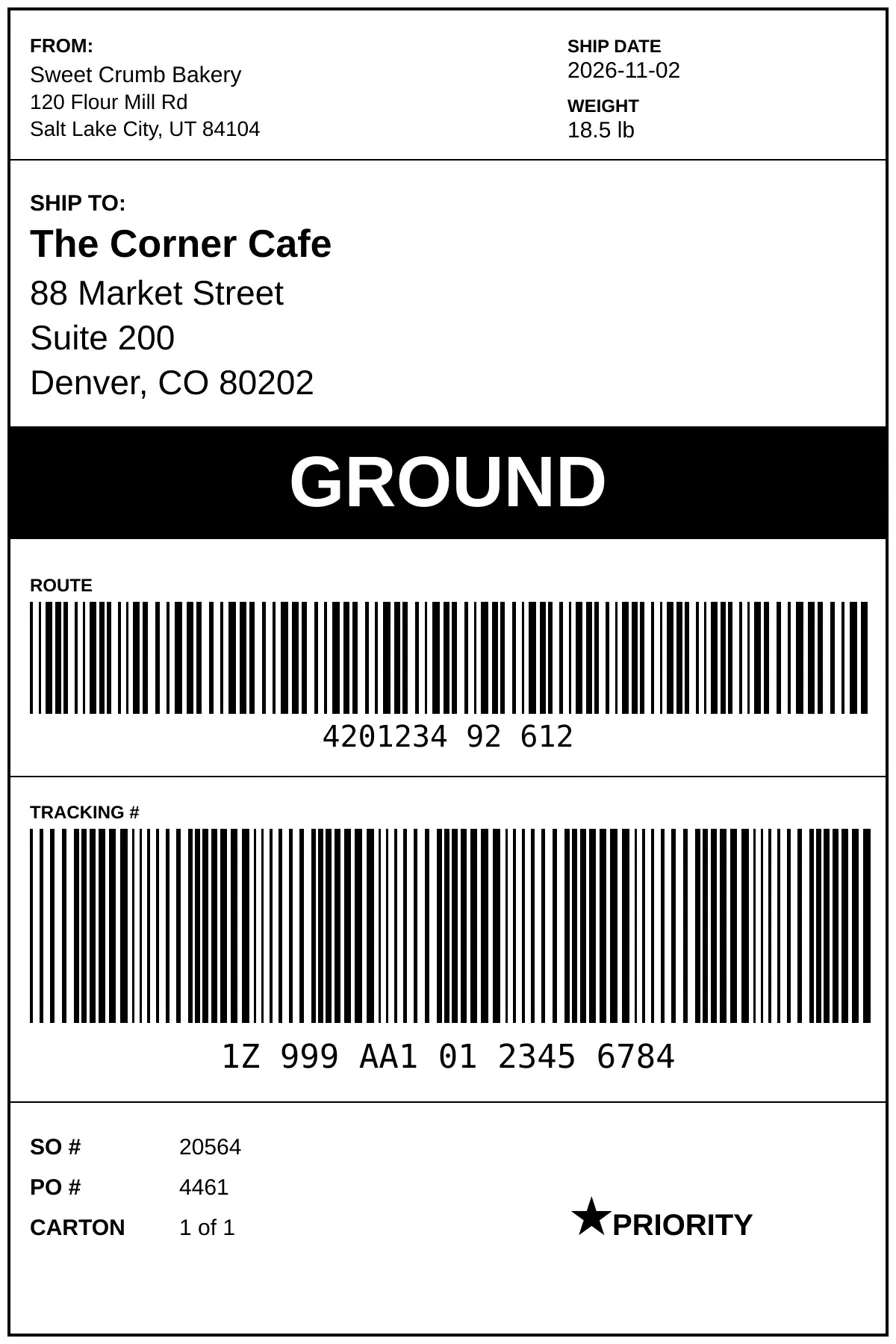 here's the shipping label we want - can you build this as a printable 4x6 label in Fishbowl?
Shipping Label 4x6 is installed in Fishbowl under Company › Labels and shows up in the Shipping module's print menu. It prints one 4x6 page per carton of the selected shipment. For now only admins can see it; an admin needs to grant your user groups access.
Where each field comes from
| Label | Fishbowl source |
|---|---|
| FROM | Default company name and its Main Office address |
| SHIP DATE | Date the shipment shipped, or today if it hasn't shipped yet |
| WEIGHT | The carton's freight weight and unit (defaults to lb) |
| SHIP TO | The shipment's ship-to name, address (multi-line), city, state and ZIP |
| Black bar | Carrier service name (e.g. GROUND); falls back to the carrier name |
| ROUTE | 420 + ship-to ZIP as a Code 128 barcode, e.g. 42080202 |
| TRACKING # | The carton's tracking number as a Code 128 barcode; shows "(no tracking number)" if blank |
| SO # / PO # | SO number and customer PO |
| CARTON | "1 of 3" style, per carton |
| PRIORITY | Black tag, shown only when the SO priority is 1-Highest or 2-High |
Things to check on your first test print
- Addresses aren't verified yet. My data access blocks reading ship-to and address fields, so I tested every other field against shipment S20564 but couldn't check those. Print one real shipment and confirm the FROM and SHIP TO blocks look right.
- The star became a black tag. Fishbowl's report font may not have a ★ character, so I used a black "PRIORITY" box instead.
- Set the label size on the printer. In the thermal printer's driver, set the media to 4×6 in. The report is laid out at exactly that size with ⅛" margins.
To change the layout or what any field shows, ask me to edit report 212.
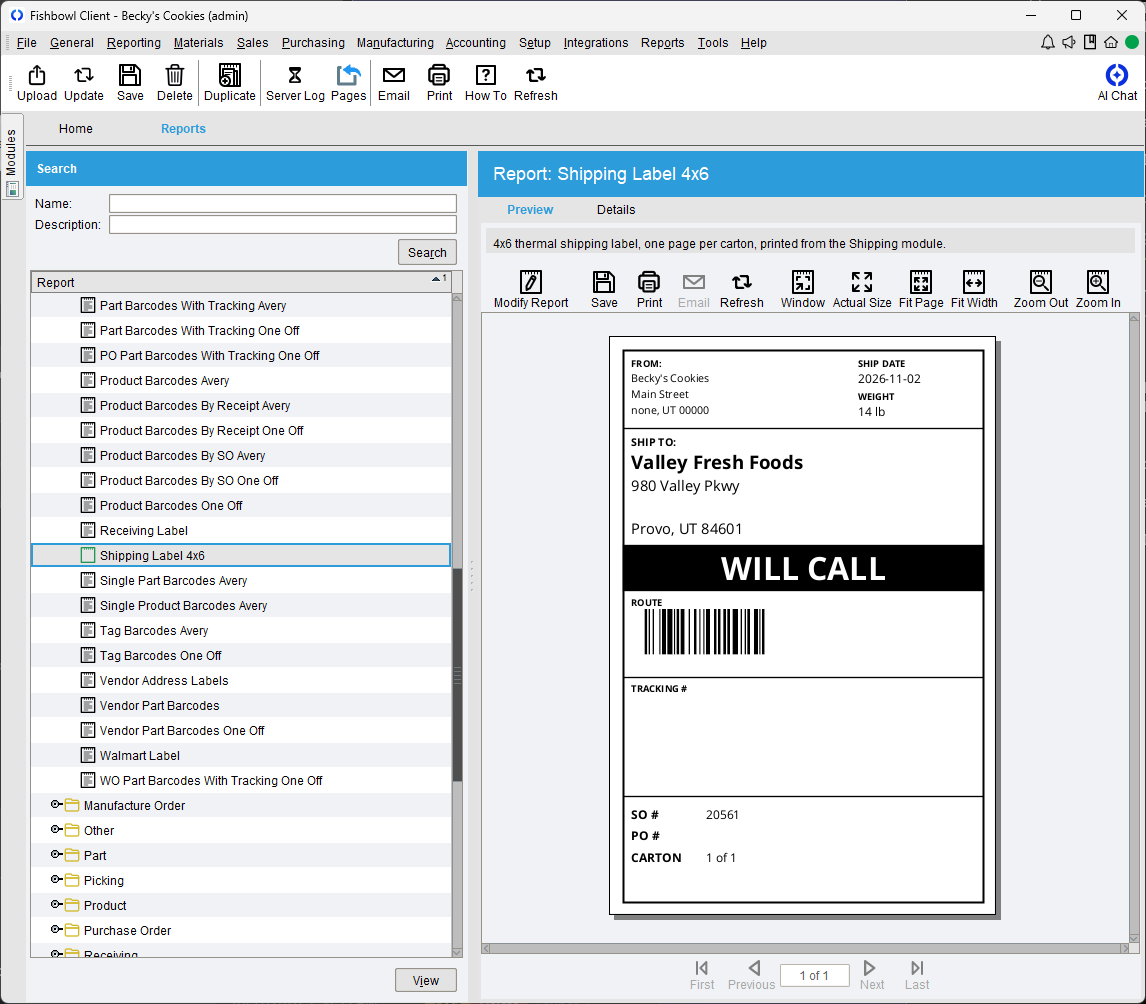
The installed report previewing a real shipment — Becky's Cookies → Valley Fresh Foods. The tracking block is blank because that shipment has no tracking number yet.
A dashboard of the numbers you watch
A request for a Sales Overview — monthly revenue, plus top products and top customers. The AI drafts it, previews it live against your data, and installs it as a BI report only on your approval.
Here's the live preview of Sales Overview, running against your Fishbowl data in read-only mode. Nothing is installed yet:
What's on it
- Period selector: last 3, 6, 12, 24 or 36 months. It opens on 12.
- KPI tiles: net revenue, order count, average order value, and last full month compared with the month before.
- Monthly revenue bar chart: the current month is shown lighter because it's still in progress. Hover over a bar to see its revenue and order count.
- Top 10 products and top 10 customers: each shows revenue and its share of the total, with a share bar.
How revenue is defined. Please check this matches how you count sales:
- Orders are bucketed by issue date (order basis), not ship date.
- Revenue counts the order statuses Issued, In Progress, Fulfilled, Closed Short and Historical. It leaves out Estimates, Voided, Cancelled and Expired.
- Revenue is net of credit returns and discounts. Tax, shipping and subtotal lines are excluded.
- Product share is calculated against product sales only, because order-level discounts can't be tied to a product.
Sanity check, last 12 months: September was the strongest month at about $86.8K. Chocolate Chips (CR403) is the top product at about 14% of product sales. Allen's Groceries is the top customer at about $22.7K.
Once you've looked, tell me what to change, or say "install" and I'll put it into the BI Report module as "Sales Overview." After it's installed, a Fishbowl admin will need to grant groups access before anyone else can see it.
Sales Overview is installed in Fishbowl's BI Report module and shows up there now, with no restart needed. The preview ran with no errors.
At the moment only Fishbowl admins can open it. For anyone else to see it, an admin needs to give their group View (or Edit Settings) access on the Sales Overview BI report in Fishbowl.
This install is saved as version 1. If you want changes later, just ask and I'll update this same report, so the access settings stay in place.
A reusable query, run with your own inputs
Someone wants a weekly list of slow-moving ingredients. The AI writes the query, runs it to check the numbers, and saves it as a reusable Data Module query — your team runs it with their own inputs, never the raw SQL.
The list is saved in Fishbowl as slow_moving_ingredients. Each week, just ask me to "run slow_moving_ingredients," or say something like "slow movers, last 60 days," and I'll run it with that window.
Today's results (90-day usage window)
Truly stalled:
| Part | Ingredient | On hand | Value | Last used | Flag |
|---|---|---|---|---|---|
| B203 | Chocolate Syrup | 2,379 oz | $787 | Jul 15 (110 days) | No usage in 90 days |
| B200 | Cocoa Powder | 4,552 oz | $1,584 | Sep 30 (33 days) | Idle |
Most overstocked (by weeks of supply at the current usage rate):
| Part | Ingredient | On hand | Value | Weeks of supply |
|---|---|---|---|---|
| BD301 | White Sugar | 16,787 lbs | $16,787 | ~1,340 |
| B202 | Baking Soda | 10,115 oz | $3,658 | ~719 |
| B204 | Salt | 7,523 oz | $2,757 | ~576 |
| BP203 | Butter | 10,950 oz | $8,369 | ~494 |
| H903 | Sliced Almonds | 3,498 oz | $1,242 | ~278 |
| H904 | Chopped Peanuts | 2,851 oz | $931 | ~270 |
| F103 | Cream of Tartar, Brand X | 2,102 oz | $694 | ~260 |
| T1002 | Lemon Cake mix | 1,696 lbs | $2,968 | ~202 |
There are 25 more items over a year of supply. The biggest dollar amounts sitting still are Vanilla Extract ($12.5k, ~130 weeks) and Chocolate Chips ($4.5k, ~59 weeks).
How it decides
- Ingredient: any active inventory part that isn't a finished good on a BOM, has stock on hand, and isn't a test part.
- Movement: shipments plus consumption by work orders and BOMs. Adjustments and scrap don't count as movement.
- Flags:
- *No usage* means nothing used in the window.
- *Idle* means no usage in 30+ days.
- *Overstocked* means 52+ weeks of supply.
- Adjustable: you can change all three thresholds per run.
Nearly every ingredient clears the 52-week bar right now, so the "Overstocked" section is long. If you want a tighter list, I can raise the default to 104 weeks or so.
Want me to set this up as a scheduled task that runs every Monday morning and sends you the list?
Sounds good. Just ask for slow_moving_ingredients whenever you want it, and I'll run it fresh.
Previewed, approved, versioned
Every report is drafted from a plain-language request, checked with diagnostics, and shown to you before anything is installed. It runs under your own Fishbowl login, and each install is kept as a version your admins can read, roll back, or uninstall — all from the chat. See how reporting fits with Ask and Act →
Imagine these on your own Fishbowl data
Tell us the reports your team rebuilds by hand, and we'll show you how ILC MCP would draft them with you.